
Between 2021 and 2025, Canada saw a huge level of political shifting. In Quebec, voters switched in droves from the Bloc to the Liberals. In the suburbs of Toronto, the vote shifted more to the Conservatives. In interior B.C, the LPC gained many votes from the NDP and GPC, allowing them to pick up Kelowna and compete in other ridings.
Here in Ottawa-Gatineau, we saw quite a bit of interesting demographic shifts, and in this article, I will talk about these shifts! From the CPC losing vote share in certain ridings, to other ridings flipping altogether, to minor parties significantly dropping off, here is an analysis of the 10 ridings that comprise of the Ottawa-Gatineau Federal Election results.
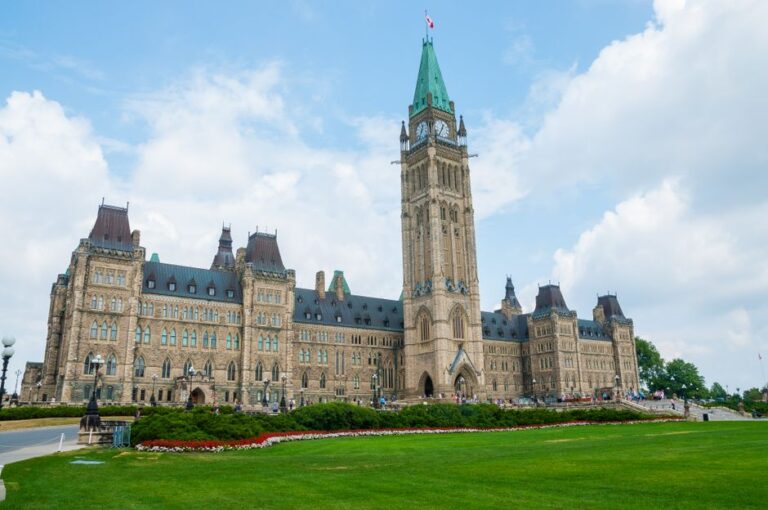
Ottawa-Gatineau Federal Election: Regionwide Shifts from 2021
In 2025, the 10 districts that comprise Ottawa-Gatineau cast a total combined 706,242 ballots. This represents quite a large increase from the figure of 632,394 votes cast in 2021, with over 70,000 new Ottawans and Gatineauans voting this time around. Though Quebec-side turnout only very marginally increased, ridings in Ottawa, particularly in the west, saw huge turnout increases. Carleton, Kanata, and Ottawa West-Nepean each saw an increase of over 10,000 ballots from 2021.
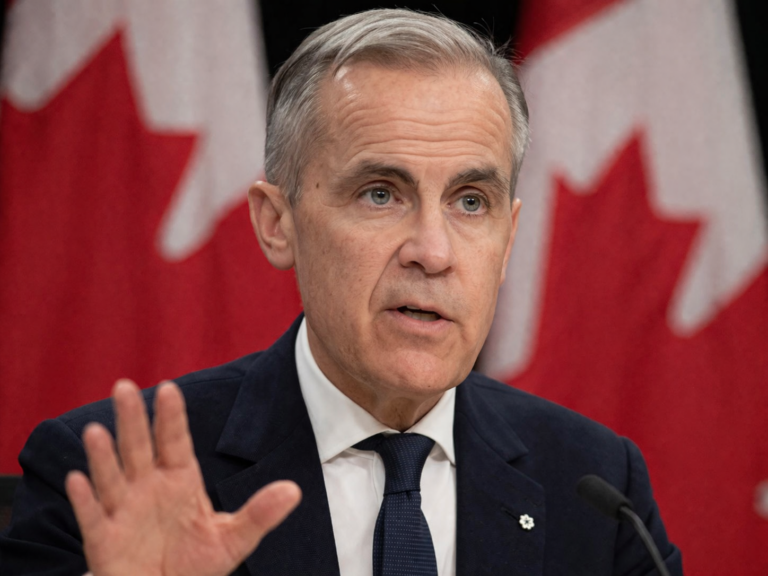
Over the region as a whole, the Liberals came out the big winners in 2025, amassing roughly 440k votes for a jaw-dropping 62% of the popular vote – up from 46% in 2021. This increase evidently came at the expense of every other party, who all saw decreases from 2021. The exception to this rule is the CPC, who saw their vote share in the region go from 26.9% to 27.8%, a far less drastic increase than the party saw nationwide.
For all of the minor parties in the National Capital Region, support was reduced to mere fractions of 2021 levels. The NDP received 17.5% of Ottawa-Gatineau’s popular vote in 2021, which dropped to just 5.8% in 2025. For the Greens, this decrease was from 2.3% to just a shade over 1%. For the PPC, support dropped from 3% to only 0.3%.
For the latter two parties, candidates were fielded in all 10 ridings of the NCR in 2021. In 2025, however, the People’s Party only ran candidates in 6 of the 10 ridings, and the Greens were unable to field a candidate in Gatineau.
In the two Quebec ridings of the region, the Bloc went from receiving 19.6% of the vote in 2021 to just 14.2% in 2025.
All of this may represent a general shift towards two-party politics in Canada. Despite running strong candidates, the NDP and other minor parties are bleeding votes to the two major parties.
Ottawa-Gatineau Federal Election: Individual Riding Oddities
Overall, a few things can be extrapolated looking at how each individual riding swung between 2021 and 2025. First, the Liberal Party increased more in Ottawa than in Gatineau and Aylmer. Within Ottawa, increases were pretty consistent for the LPC, though it appears they did marginally better in ridings with older voters, gaining the most votes in Carleton.
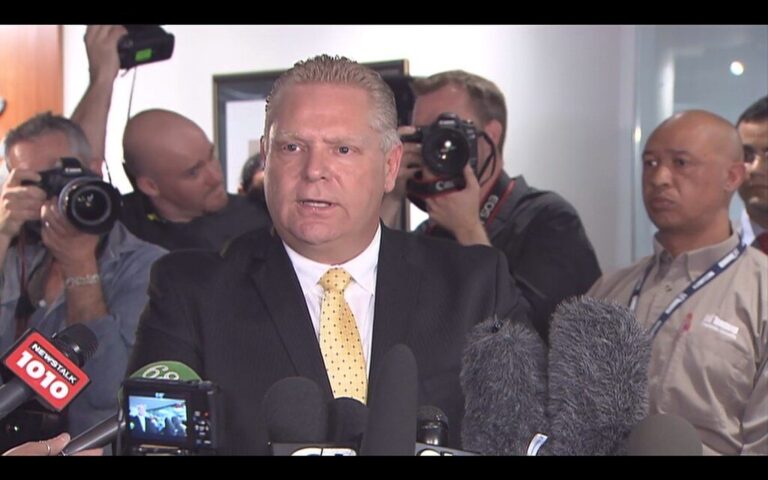
Secondly, the Conservatives actually decreased vote share slightly in Ottawa, only increasing in the region overall due to quite sizeable increases Quebec-side. Particularly, they had an abysmal showing in Carleton, where Conservative leader Pierre Poilievre dropped 6% from what he received in 2021.
Finally, it appears as though losses for other parties were pretty consistent across the board. There are some disparities between losses in ridings for these parties, but these can generally be explained by these parties having less votes to lose to begin with. The NDP didn’t had an abundance of votes in Gatineau in the first place, so it makes sense that they lost less. Relatively, it evens out.
| % change from 2021 | Liberal Party of Canada | Conservative Party of Canada | New Democratic Party | Green Party of Canada | People’s Party of Canada | Bloc Québécois |
| Carleton | +19.1% | -6.2% | -10.0% | -1.5% | failed to run | n/a |
| Kanata | +17.6% | -1.2% | -12.4% | -1.4% | failed to run | n/a |
| Nepean | +18.0% | -0.1% | -14.3% | -1.3% | -2.4% | n/a |
| Orleans | +15.4% | -0.9% | -11.8% | -0.8% | -2.2% | n/a |
| Ottawa-Vanier-Gloucester | +18.4% | +0.9% | -15.7% | -1.1% | -2.7% | n/a |
| Ottawa Centre | +17.5% | -0.7% | -13.2% | -1.7% | failed to run | n/a |
| Ottawa West-Nepean | +18.2% | -0.6% | -13.2% | -1.8% | -2.5% | n/a |
| Ottawa South | +16.7% | +0.7% | -13.3% | -1.4% | failed to run | n/a |
| Gatineau | +10.5% | +8.0% | -5.8% | failed to run | -3.2% | -7.1% |
| Hull-Aylmer | +9.7% | +6.2% | -7.2% | -0.6% | -3.0% | -4.0% |
Above is a swing chart of the Ottawa-Gatineau Federal Election between 2021 and 2025. Figures may change as votes are certified.