
Let’s be honest, staring at a sea of brake lights on the 417 is practically an Ottawa rite of passage. If you're tired of losing precious time to unexpected gridlock, you're in the right place. We're going to dive into how an Ottawa traffic map can become your secret weapon for outsmarting the daily commute.
Why a Traffic Map Is Your Best Friend on the Road
Think of a live traffic map as your co-pilot, constantly scanning the roads ahead to find the clearest path. It's so much more than a digital road atlas; it's a dynamic tool that shows you where the trouble spots are popping up right now. This gives you the power to make smarter decisions before you even pull out of your driveway.
The reality of commuting in the capital can be a real grind. According to TomTom's detailed index, in 2023, the average 10-kilometre trip in Ottawa took 13 minutes and 50 seconds, an increase of 20 seconds from the previous year. During the evening rush, that same trip could stretch to over 17 minutes. Over the course of a year, the average commuter lost 61 hours to rush-hour traffic.
A traffic map lets you be proactive, not reactive. Instead of getting stuck in a slowdown and then trying to escape, you can see it forming and pivot to a better route entirely.
This strategic approach helps you sidestep the usual chokepoints and construction zones, which saves you time, fuel, and a whole lot of frustration. It’s all about taking back control of your travel. And let's be real, staying ahead of traffic can also help you dodge those costly mistakes, like getting a parking infraction notice when you’re scrambling to find a spot.
How Live Traffic Data Actually Works
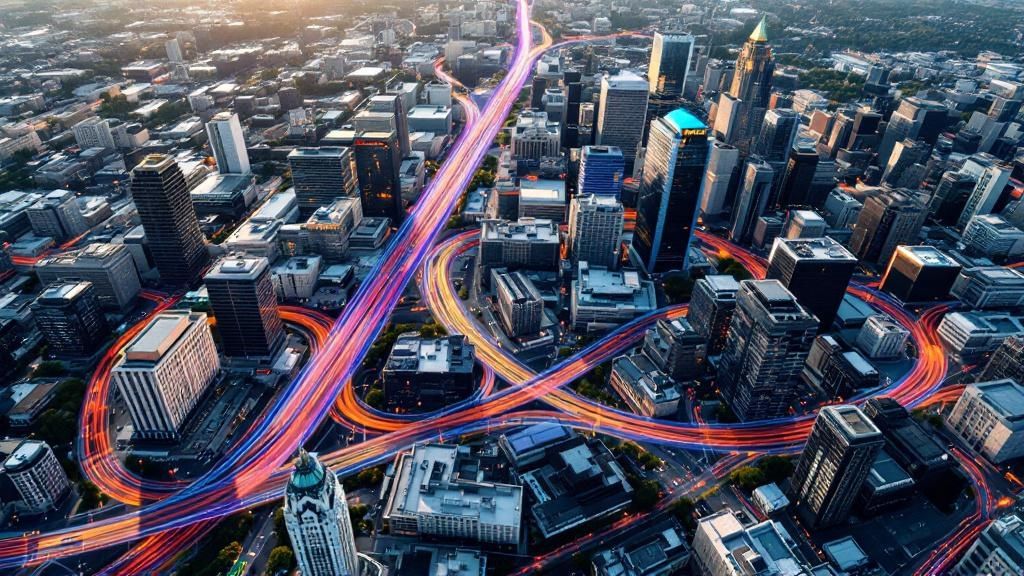
Ever wondered how your map knows about a slowdown on the Queensway before you even see brake lights? A modern Ottawa traffic map isn't just a static image. It's a living, breathing system, constantly fed by a stream of information from different sources all working together.
Think of it as a city-wide intelligence network. This network pieces together data from a few key places to create a surprisingly complete picture of how traffic is moving. Once you understand where this information comes from, you can trust the map's accuracy and make smarter decisions on the fly.
The Three Pillars of Traffic Data
The real-time magic of your traffic map comes from blending three key types of information:
- GPS and Cellular Data: This is the big one. Anonymized signals from our smartphones and in-car navigation systems provide the bulk of the data. As thousands of us move around the city, these signals paint a live picture of traffic speed, showing whether cars are flowing freely or crawling along.
- Official Road Sensors: The City of Ottawa and other transportation authorities have embedded sensors directly into major roadways and on traffic lights. These sensors are the ground truth, directly measuring how many vehicles are passing and how fast they're going on critical arteries like Hunt Club or the Sir John A. Macdonald Parkway.
- Crowdsourced Reports: This is where you and I come in. Apps like Waze let drivers become active participants, reporting accidents, construction zones, police presence, or other hazards in real-time. These user-submitted alerts add a layer of on-the-ground detail that automated systems might otherwise miss.
An example of an official data source is the City of Ottawa's own open data portal, which provides foundational information on things like planned construction projects and traffic volumes.
This logo represents the official channels that feed the map essential data on things like road closures and upcoming construction work.
By weaving these different streams together, a traffic map’s algorithm can build a highly accurate and predictive model. It doesn’t just show you where traffic is bad right now; it can often predict where it’s about to get bad. This powerful combination is what lets you confidently pick an alternate route and shave precious time off your commute.
How to Read Your Traffic Map Like a Pro
Learning to decode the Ottawa traffic map is a lot like learning a new language. At first, it's just a bunch of colourful lines and symbols. But once you get the hang of it, you can instantly see where your commute will be smooth sailing and where you’re likely to hit a snag. It's about looking past the lines on the screen and seeing the real-world conditions they represent.
The most basic signals are the colours. Each one tells a story about how fast traffic is moving on a particular stretch of road. Mastering them is the first step toward becoming a more strategic driver.
Decoding the Colours of Congestion
Think of the map's colour-coding as a simple status light for your route:
- Green: Clear sailing. Traffic is flowing smoothly at the speed limit with no delays.
- Orange/Yellow: Things are starting to slow down a bit. You'll probably hit moderate traffic but you'll still be moving, just slower than usual.
- Red: This means heavy traffic. Brace yourself for significant delays—you'll be moving at a crawl or stuck in stop-and-go conditions.
- Dark Red/Maroon: Gridlock. Traffic is either at a complete standstill or barely moving at all. If you see this, find another route. Fast.
For example, seeing a bit of orange on Colonel By Drive during your morning drive isn't unusual. But if that line turns dark red, you know there’s a serious problem ahead that you’ll want to avoid.
Understanding Key Icons and Alerts
Beyond the colours, your map uses icons to give you the why behind a delay. Recognizing these symbols is the key to making smart rerouting decisions on the fly.
This infographic breaks down some of the key data points about Ottawa's traffic landscape.

When the data shows a significant chance of delays on major arteries like Bank Street, knowing what those little icons mean becomes essential for any commuter.
Common symbols you'll see are for collisions, road construction, and full closures. A simple construction icon on Bank Street might just mean a minor lane reduction, but a collision icon on the Queensway often triggers major, widespread backups that are best avoided entirely.
Here's a quick reference table to help you make sense of it all at a glance.
Quick Guide to Traffic Map Colors and Icons
Use this reference to quickly understand what the symbols and colors on your traffic map mean for your commute.
| Element | Meaning | What You Should Do |
|---|---|---|
| Green Line | Clear traffic, moving at speed limit. | Continue on your route. No action needed. |
| Orange/Yellow Line | Moderate traffic, some slowing. | Proceed with caution. Be prepared for minor delays. |
| Red/Dark Red Line | Heavy traffic or gridlock. | Avoid this route if possible. Seek an alternative. |
| Collision Icon | An accident has occurred. | Reroute immediately. Accidents often cause long delays. |
| Construction Icon | Road work ahead. | Check for lane closures. Might be a minor delay. |
| Closure Icon | Road is closed to traffic. | You must find an alternate route. This road is impassable. |
By combining your understanding of the colours and icons, you can size up a situation in seconds. This lets you decide whether to stick it out or find a better way before you get stuck.
Choosing the Best Ottawa Traffic Map App
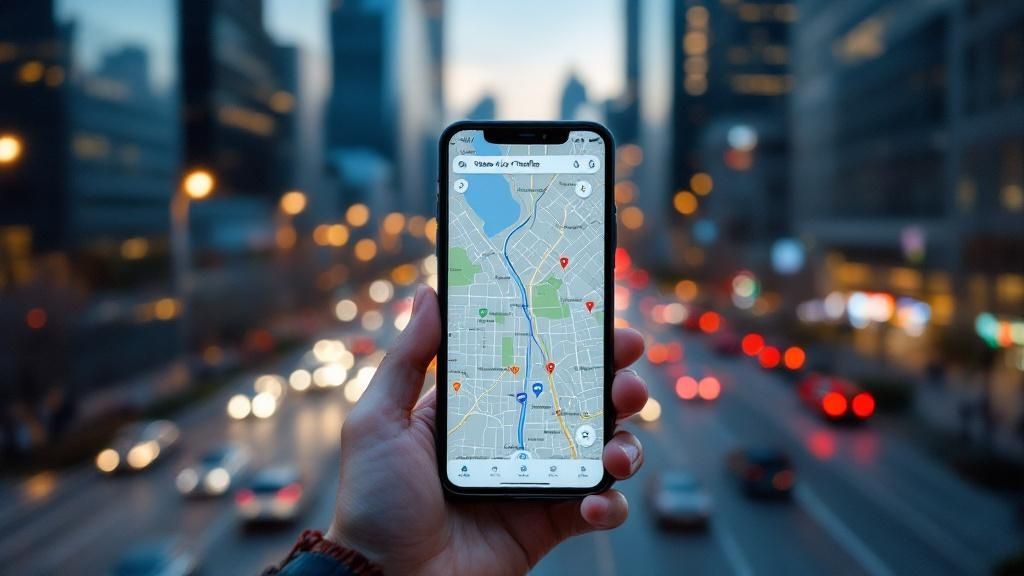
When it comes to picking an Ottawa traffic map app, the best choice really depends on what your commute looks like that day. With a few excellent tools at your fingertips, it’s worth knowing which one to pull up, because not all apps are built the same. Each has its own strengths that can be the difference between a smooth ride and a frustrating crawl through the city.
For your day-to-day driving, the big names like Google Maps and Waze are tough to beat. They’re masters of real-time, dynamic rerouting, constantly pulling in live data to steer you around those sudden slowdowns. If getting there as fast as possible is your main goal, these are your go-to apps.
Community Insights vs. Official Data
Waze's secret weapon has always been its community. Drivers are constantly reporting everything from hidden potholes and debris on the road to the location of police speed traps. This layer of user-generated intel gives you a ground-level view that automated systems just can't replicate.
On the other hand, the official City of Ottawa traffic map is the undisputed source for planned disruptions. If you're looking for information on major construction projects, road closures for festivals, or other official events, this is where you'll find the most reliable details. While it won't aggressively reroute you like Waze, it’s absolutely essential for planning ahead. You can get a heads-up on scheduled closures by checking our guide on upcoming Ottawa events.
The smartest strategy? Use them together. Give the City map a quick look before you leave for any major closures, then fire up Waze or Google Maps to handle the unexpected stuff that pops up along the way.
This blended approach makes sure you're ready for both the planned headaches and the surprise traffic jams. And in Ottawa, it’s worth the extra step. According to a recent traffic index, Ottawa ranks 9th in Canada for congestion, with motorists spending an average of 20 extra seconds per 10 km journey in 2023, as highlighted by CTV News Ottawa. This underscores how valuable the right tools can be.
Advanced Strategies to Beat Ottawa Traffic
Ready to stop reacting to traffic jams and start proactively sidestepping them altogether? Mastering an Ottawa traffic map is about more than just a quick glance before you grab your keys. It's about shifting your mindset and adopting a few smart habits to become a truly strategic commuter, saving you time and frustration before it even begins.
A powerful—and often overlooked—feature in most map apps is historical data. You can use it to get a real-world estimate for important trips in the future. For example, if you have a doctor's appointment next Tuesday at 3:00 p.m., you can set the app to that specific day and time. This gives you a much more accurate picture of what traffic will actually be like, instead of just relying on the current, real-time conditions.
Proactive Planning for Key Routes
Instead of waiting for an alert that you’re headed into a bottleneck, identify your personal chokepoints—we all have them, whether it's the Airport Parkway or Hunt Club Road during rush hour. Go ahead and map out a few permanent alternate routes. During peak times, make these your go-to options. The goal is to build a habit of avoidance, not just last-minute reaction.
The most effective strategy is to make traffic awareness a key part of your decision-making process. Before automatically grabbing your car keys, check the map. This is especially true for trips where public transit is a viable option.
A quick look might reveal that driving will take 45 minutes, while the O-Train could get you there in 30. That simple check is a game-changer, especially when events cause ripple-effect delays across the city. For instance, a surge in activity around the airport can unexpectedly clog surrounding roads. This trend is backed by a recent report from Statistics Canada, which noted an 8.6% increase in passenger traffic at Ottawa/Macdonald-Cartier International Airport in April 2024 compared to the previous year.
Finally, take advantage of smart departure alerts. Most map apps let you plug in your destination and desired arrival time. The app then does the work for you, monitoring traffic and sending a notification telling you the perfect moment to head out. This is a lifesaver during major city events that throw normal traffic patterns out the window. To stay ahead of those big disruptions, be sure to check our guide on what to expect for Canada Day 2025 in Ottawa.
Got a question about getting around the capital? We all do. When you're trying to outsmart traffic using a live Ottawa traffic map, a few things might pop into your head. Let's clear up some of the most common questions from local drivers.
How Often Does the Map Actually Update?
Most of the big players, like Google Maps and Waze, refresh their data every few minutes. This near-constant stream of information is what makes them so powerful. It allows the system to catch a new slowdown almost as it happens, giving it enough time to find you a better way to go.
Can I Really Trust Reports from Other Drivers?
It's a fair question, but crowdsourced alerts are surprisingly solid. They're a cornerstone of how modern traffic apps work. Think of it this way: when one person reports an accident, it might be a mistake. But when a dozen drivers in the same spot all report the same thing? That's when the system knows it's legit and flags it for everyone else.
This collective intelligence is the secret sauce. It’s what makes community-powered apps so quick to pinpoint real-world problems right as they unfold, from a fender bender to a piece of debris on the highway.
How Badly Do Big Events Mess Up Traffic?
Major events like Canada Day, Bluesfest, or even a big convention at the Shaw Centre can throw a serious wrench in traffic patterns, and the chaos often spreads far beyond the event itself. A few closed streets downtown for a parade can easily turn arteries like the Queensway into parking lots as everyone scrambles for an alternate route.
Your best bet? Check the City of Ottawa’s website for planned closures before you head out. Then, keep your live map running to navigate the unpredictable ripple effects that always follow.
And remember, always use your map hands-free. Get your phone mounted or use your car’s built-in screen. Plug in your destination before you start driving and let the voice navigation guide you. Your focus should always be on the road.
For the latest news and insights on navigating the National Capital Region, trust ncrnow. Stay informed and ahead of the curve by visiting us at https://ncrnow.ca.