

When the lights go out, your first thought is probably, "How long will this last?" The key to answering that question is finding a reliable power outage map for Ontario. But here's the thing: there isn't one single map for the entire province. Instead, you'll need to check the specific map from your local utility provider.
Companies like Hydro One, Alectra Utilities, and Toronto Hydro all run their own real-time outage maps to keep customers in the loop.
Where to Find Your Local Power Outage Map
When you're in the dark, getting fast and accurate information is everything. Ontario’s power grid is managed by over 60 different Local Distribution Companies (LDCs), and each one is responsible for the power lines in its specific territory. That means each LDC provides its own live outage map.
Think of it this way: Hydro One manages the major energy "highways" that transport power across the province. LDCs like Alectra Utilities or Hydro Ottawa are in charge of the local "streets" that deliver that power right to your front door. So, to get the real story on an outage affecting your home, you have to go directly to your local provider's website.
To make it easier, we've compiled direct links to the outage maps for some of Ontario's largest electricity providers.
Official Outage Maps for Major Ontario Utilities
Use these direct links to find live power outage maps from the largest electricity providers in Ontario.
| Utility Provider | Primary Service Areas | Direct Link to Outage Map |
|---|---|---|
| Hydro One | Rural and Northern Ontario, various municipalities | Hydro One Outage Map |
| Alectra Utilities | Greater Golden Horseshoe Area (e.g., Hamilton, Mississauga, York Region) | Alectra Utilities Outage Map |
| Toronto Hydro | City of Toronto | Toronto Hydro Outage Map |
| Hydro Ottawa | City of Ottawa and Village of Casselman | Hydro Ottawa Outage Map |
| Elexicon Energy | Durham Region and surrounding areas (e.g., Ajax, Pickering, Whitby) | Elexicon Energy Outage Map |
Finding your specific provider is the first and most important step to getting timely updates.
What the Maps Will Tell You
These digital maps are your best friend during a blackout. They’re designed to give you a clear, visual snapshot of what’s happening on the ground so you can figure out what to do next.
Most utility outage maps will show you:
- Affected Areas: You'll see colour-coded or highlighted zones showing the exact boundaries of the power outage.
- Number of Customers Impacted: A running tally of how many homes and businesses are currently without electricity.
- Cause of the Outage: When known, the map will list whether the outage was caused by a storm, a traffic accident, or equipment failure.
- Estimated Time of Restoration (ETOR): This is the utility’s best guess for when the power will be back on. Keep in mind this can change as crews assess the damage.
So, Why Do Power Outages Happen, Anyway?
Ever find yourself sitting in the dark, wondering why the lights suddenly went out? Think of Ontario’s electrical grid like a massive, intricate highway system for electricity. When everything is humming along, power gets to where it needs to go—your home. But just like any highway, it’s vulnerable to disruptions that can cause a major "traffic jam," or in this case, a blackout.
The most common culprit is, you guessed it, severe weather. Ontario’s harsh winters can bring brutal ice storms that coat power lines, weighing them down until they snap. Come summer, it’s the powerful thunderstorms and high winds that send trees and branches crashing onto wires, causing widespread damage.
It's Not Just Mother Nature
While storms are a huge factor, they aren’t the only reason the power goes out. The grid is up against all sorts of daily challenges that can knock your service offline.
- Animal Shenanigans: It sounds a bit funny, but squirrels, raccoons, and birds are one of the most frequent causes of localized outages. They can chew through wiring or get a little too curious with equipment at substations, creating short circuits.
- Aging Infrastructure: Our electrical grid is a complex web of transformers, wires, and switches. Like any machine, these parts wear out over time. When a critical component fails, it can lead to an unexpected blackout that needs immediate, hands-on repairs.
- Car Accidents: When a car slams into a utility pole, it can instantly cut power for an entire neighbourhood. Crews then have the tough job of replacing the pole and re-stringing all the lines.
These incidents really put the grid's constant vulnerability on display. For example, in May 2022, a devastating derecho storm swept across Ontario, causing one of the largest power outages in the province's history. It left over a million customers without power, with some rural areas in the dark for weeks. This single event highlighted the increasing threat of severe weather events on our infrastructure.
Power disruptions aren't always isolated to the electrical grid; other essential services often feel the ripple effect. A significant Bell outage in Ontario and Quebec showed just how interconnected our infrastructure is, with communication lines going down right alongside power.
Knowing what causes these outages gives you a much clearer picture of the constant work required to keep the lights on. From battling storms to outsmarting squirrels, utility crews are on the job around the clock, tackling these complex challenges to get your power back on as fast as they can when you check a power outage map for Ontario.
How to Read and Interpret an Outage Map
When the power goes out, pulling up your local power outage map in Ontario can feel like staring at a foreign language. It often looks like a chaotic mess of colours, shapes, and icons, but it's actually designed to give you the clearest picture possible during a pretty stressful time.
Think of it like a weather map for your electricity. Once you know what the symbols mean, you can read the whole story of what's happening in your area.
Most maps use a simple colour-coded system to show the scale of an outage. A single, small icon might represent a problem affecting fewer than 50 homes—often a localized issue. On the other hand, a large, angry-looking red or orange blob usually signals a major disruption impacting thousands of customers. These visuals are your first clue about how serious the situation is.
Here’s a look at a typical Hydro One outage map, which shows exactly how these incidents are displayed with different shapes and handy pop-up details.

This screenshot shows how the map pinpoints specific areas, telling you how many customers are affected and giving you status updates right on the screen.
Decoding Key Information
Beyond the flashy colours, every map has a treasure trove of details to help you plan your next move. Look for a clickable icon or a sidebar where you can dig into the specifics for your neighbourhood. This is where you'll find the most important pieces of the puzzle.
Here's what to look for:
- Customers Affected: This number gives you a sense of the outage's scope. A smaller number could mean a quicker fix, while a massive number might signal a more complicated repair job.
- Cause of Outage: When they know what's wrong, the utility will list it here. You'll often see things like "severe weather," "equipment failure," or my personal favourite, "animal contact."
- Estimated Time of Restoration (ETOR): This is the utility’s best guess for when your power will be back. It's crucial to remember this is just an estimate—it can and will change as crews get a better handle on the situation.
The ETOR is always a moving target. Early on, it’s just a rough guess. Once crews are on-site and can actually see the damage, the timeline becomes much more reliable. It’s always a good idea to check back for updates.
Understanding Crew Status Updates
Finally, you’ll often see short status updates that tell you what’s happening on the ground. These little phrases are your window into the repair process.
"Crew dispatched" means help is on the way. "Assessing damage" tells you they're still figuring out the extent of the problem. Once you see "crew on-site" or "repairs underway," you can breathe a little easier—it means work has officially started to get your lights back on.
Who Actually Controls Your Power in Ontario?
When the lights flicker and die, it’s easy to blame a single, faceless entity you might just call "Hydro." But the reality is a bit more complicated. Ontario’s power grid is run by a team of different players, and knowing who’s on your team is the first step to finding the right power outage map in Ontario.
Think of it like a delivery service for electricity.
Hydro One is the long-haul trucker of the power world. They operate the province's massive transmission system—the "energy superhighways" that carry high-voltage electricity over huge distances. They’re responsible for getting power across vast rural areas and connecting different parts of the province. If you live outside a major urban centre, chances are Hydro One is your provider.
But once that power gets to your city or town, someone else takes the wheel.
Your Local Distribution Company Delivers the Power
This is where the more than 60 Local Distribution Companies (LDCs) come in. These are the local couriers who handle the final leg of the journey. LDCs like Alectra Utilities in the Golden Horseshoe or Hydro Ottawa in the capital manage the "local streets" of the grid. They take the high-voltage power from the superhighways, convert it to a safe, usable voltage, and deliver it right to your home.
This distinction is critical. If a storm knocks down a power line in your Mississauga neighbourhood, Alectra Utilities is the one sending out the repair crew, not Hydro One. That’s why you need to check your specific LDC’s map for the most accurate and timely updates.
To help you get a clearer picture of who does what, here’s a simple breakdown of the key players involved in keeping your lights on.
Key Players in Ontario's Power Grid
| Organization Type | What They Do | Examples |
|---|---|---|
| Generators | Create the electricity using sources like hydro, nuclear, and natural gas. | Ontario Power Generation (OPG), Bruce Power |
| Transmitters | Move high-voltage power across the province on "energy superhighways." | Hydro One |
| Local Distributors (LDCs) | Take that power, convert it, and deliver it to homes and businesses. | Alectra Utilities, Hydro Ottawa, Toronto Hydro |
Knowing these roles helps you understand who to turn to when things go wrong. For outage information, your LDC is always your best bet.
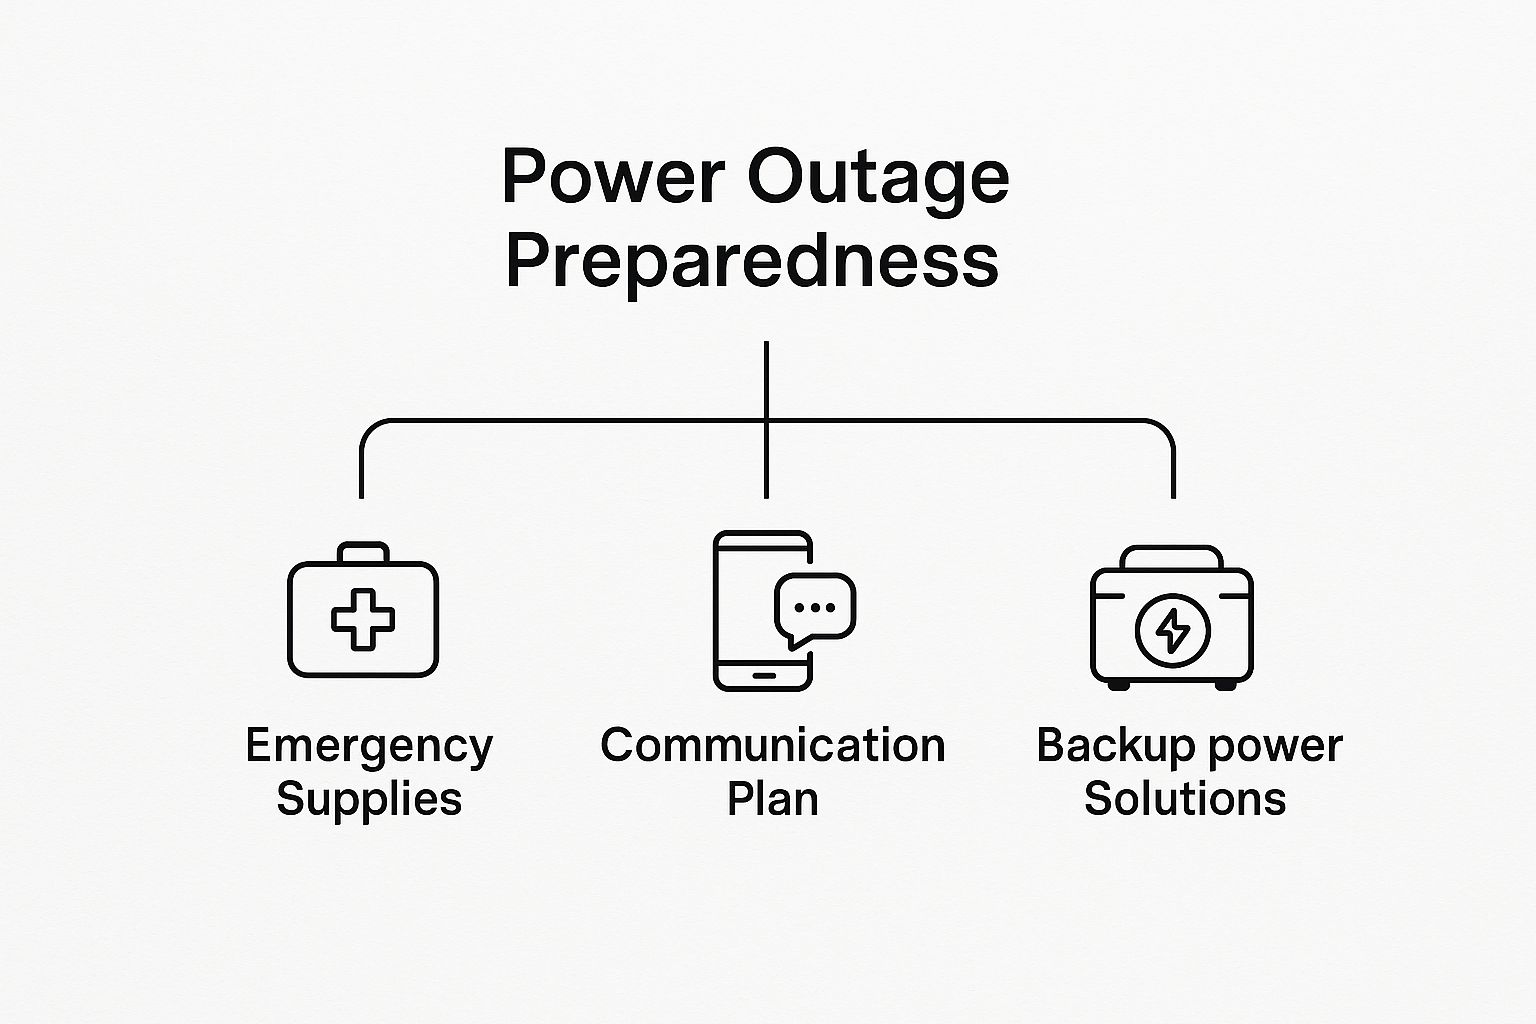
The image above outlines the key pillars of power outage preparedness. A solid plan means having supplies, a communication strategy, and maybe even a backup power solution.
By identifying your specific LDC, you add another crucial layer to that plan. Go ahead and bookmark their outage map right now—it’ll ensure you get the fastest, most relevant information when you really need it.
The Story of Ontario's Power Grid Resilience

When the lights go out, it’s easy to feel isolated. But every flicker and outage is part of a much bigger story—the ongoing effort to keep Ontario’s massive, deeply interconnected power grid humming along. Keeping this complex machine reliable is a 24/7 job, and its modern playbook was written after one historic failure forced the entire industry to change.
That wake-up call was the massive Northeast Blackout of August 14, 2003. It wasn't just a local issue; it was a catastrophic chain reaction that left 50 million people in the dark across Ontario and eight U.S. states. It all started simply enough, with overgrown trees brushing against high-voltage lines in Ohio. From there, a cascade of failures rippled across the grid, destabilizing the system for days.
The 2003 blackout exposed just how vulnerable the grid was. In its aftermath, utilities were forced to completely rethink how they collaborate and manage the system to stop a small problem from ever spiralling into a continental crisis again.
Measuring Grid Performance
So, how do we know if all those upgrades and new protocols are actually working? Utilities use a couple of key metrics to grade their own performance. Think of it as the grid’s report card, tracking how often you lose power and for how long.
These metrics aren’t just internal jargon; they are standardized tools that allow regulators and the public to see how well their local utility is performing compared to others across the province.
The two most important numbers you'll hear about are SAIDI and SAIFI.
- SAIDI (System Average Interruption Duration Index): This one measures the total time an average customer is without power over the course of a year. Simply put, a lower SAIDI means shorter outages.
- SAIFI (System Average Interruption Frequency Index): This one tracks how often the average customer loses power in the first place. A lower SAIFI means you're experiencing fewer interruptions overall.
Together, these numbers give us a clear, data-driven picture of how reliable the grid is. They push providers to keep investing in stronger infrastructure and smarter maintenance. The goal is always to drive both numbers down, which means more dependable power for everyone.
These investments are becoming even more critical as new demands arise, from climate change to electric vehicles. You can learn more about how Ontario’s homegrown EV tech could be a game-changer for the power grid in our related article.
Common Questions About Ontario Power Outages
When the lights go out, questions pop up fast. Here are some straightforward answers to the things people ask most about power outage maps in Ontario, so you can get a better handle on the situation. We'll cover the practical stuff that the maps don't always explain.
Ever wondered why your neighbour has power but you don't? It’s a classic head-scratcher. Most of the time, it’s because your homes are on different electrical circuits. A fallen tree branch or a faulty piece of equipment might have only knocked out the specific line serving your house, leaving others on your street unaffected.
Understanding Restoration Times and Reporting
Another big question is about the accuracy of the Estimated Time of Restoration (ETOR). Think of the ETOR as the utility's best guess—one that gets sharper over time. At first, it's a broad estimate while crews are still figuring out what went wrong. Once they've assessed the damage and started repairs, that ETOR becomes much more reliable. It's always a good idea to check back for updates.
You might also wonder if it’s worth reporting an outage that’s already showing on the map. The short answer? Yes. Even if the utility knows there’s a problem in your area, your report acts like a digital pin. It helps them confirm the exact boundaries of the outage, which can sometimes speed up the repair process for everyone.
While outages are an unfortunate reality, utility performance varies. For instance, some providers maintain impressive reliability records, keeping interruptions to a minimum for their customers.
Take Niagara-on-the-Lake Hydro, for example. According to the Ontario Energy Board's data, their customers experience some of the shortest and least frequent outages in the province. Their reliability metrics are consistently better than the provincial average, showcasing a strong performance in maintaining service.
Finally, it’s useful to know the difference between a blackout and a brownout. A blackout is a total loss of power. A brownout is a temporary drop in voltage—that’s when your lights might dim or flicker. Utilities sometimes trigger controlled brownouts on purpose to prevent a wider grid failure during periods of super high demand. For more on how infrastructure issues can impact daily life, you might be interested in our coverage of recent VIA Rail news.
At ncrnow, we keep you informed about the events and services that matter in Ottawa and the National Capital Region. For the latest local news and updates, visit us at https://ncrnow.ca.